The AstraZeneca (LSE:AZN) share price has shown some weakness in recent months. In fact, it fell 6.3% in the month to 9 November — Q3 results day.
One reason behind the falling share price was the disappointing results of its datopotamab deruxtecan lung cancer trial.
In a note, Jefferies analyst Stephen Barker expressed a negative assessment of the data, deeming it “worse-than-expected.”
Should you invest £1,000 in Glencore Plc right now?
When investing expert Mark Rogers has a stock tip, it can pay to listen. After all, the flagship Motley Fool Share Advisor newsletter he has run for nearly a decade has provided thousands of paying members with top stock recommendations from the UK and US markets. And right now, Mark thinks there are 6 standout stocks that investors should consider buying. Want to see if Glencore Plc made the list?
Barker’s critique focused on the drug’s marginal impact, highlighting that it only extended the time non-small cell lung cancer patients lived without the disease worsening by less than a month compared to chemotherapy.
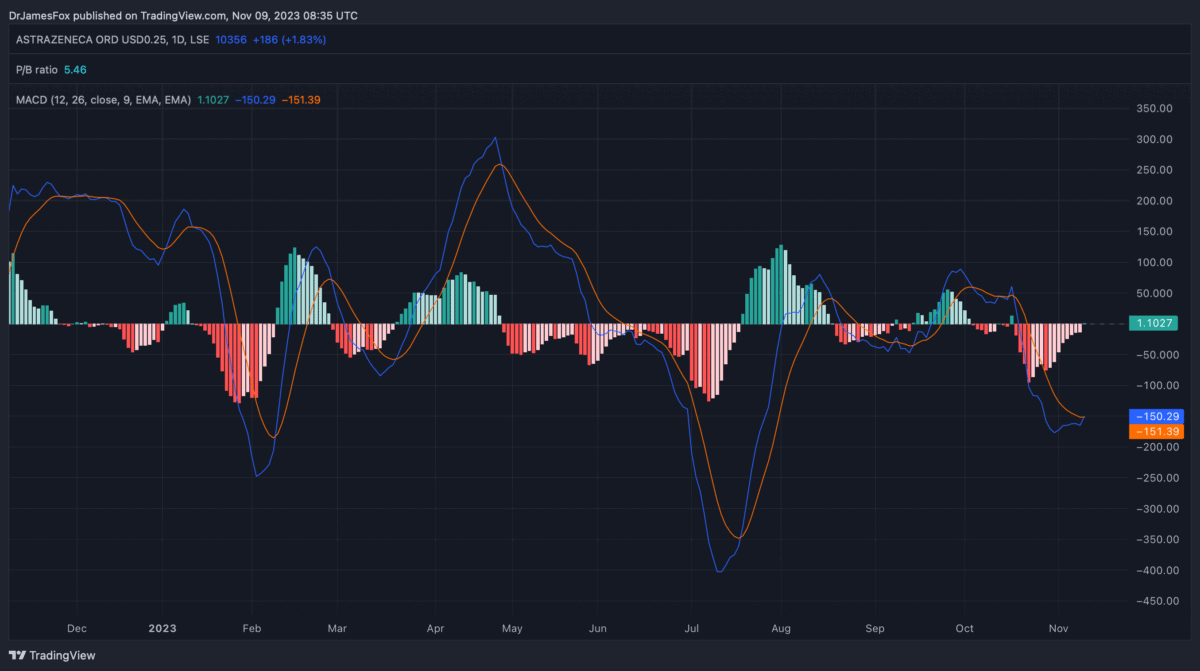
The below chart shows the trajectory of the share price along with momentum indicators.

Q3 results
On 9 November, the pharma giant saw its share price start higher after an encouraging set of Q3 results.
Total revenue for the period came in at $33.7bn, marking a 5% increase year on year, notwithstanding a $2.9bn fall in Covid medicine sales.
Excluding the impact of Covid medicines, both total revenue and product sales grew by 15%. Notably, revenue from Oncology medicines surged by 20%, CVRM by 19%, R&I by 9%, and Rare Disease by 12%.
The core product sales gross margin stands at 82%, indicating a two-percentage-point increase, primarily driven by the decline in sales of those lower-margin Covid-19 medicines.
The pharma premium
AstraZeneca is certainly among the most exciting companies on the FTSE 100. It’s at the centre of efforts to cure and treat cancers, infectious diseases and neurological conditions.
It’s also in a fairly defensive industry. With ageing populations, there’s a general appreciation that we’ll need more medicines and treatments as average ages rise.
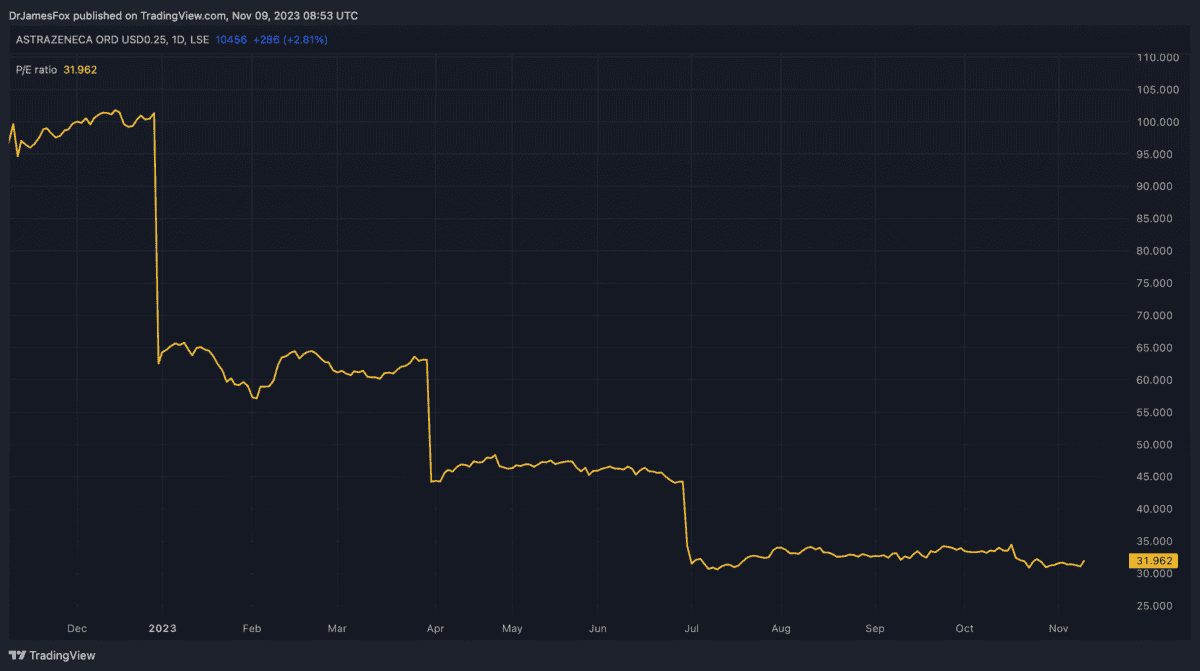
And this is very much reflected in the company’s premium valuation. But while AstraZeneca trades at 29 times forward earnings, which is double the FTSE 100 average, it’s only marginally higher than the global sector average.

Growth is key
Here’s how AstraZeneca stacks up again some of its biggest peers.
| Johnson & Johnson | Eli Lilly | Merck | Novartis | Pfizer | AstraZeneca |
|---|
| P/E GAAP (FWD) | 22.4 | 96.7 | 334.7 | 20.8 | 39.3 | 29 |
| P/E GAAP (TTM) | 28.3 | 108.6 | 57.8 | 24.2 | 17 | 31.8 |
| PEG Non-GAAP (FWD) | 5.6 | 4.5 | 4.8 | 1.9 | 6.9 | 1.5 |
| Price/Cash Flow (TTM) | 17.9 | 94.3 | 15.3 | 12 | 12.1 | 19.2 |
Taken as a collective piece of data, AstraZeneca broadly trades in line with its peers. However, there’s one particularly interesting metric, and that the PEG ratio.
This is a metric that assesses a stock’s valuation by considering its price-to-earnings ratio in relation to its expected earnings growth rate. In other words, a lower ratio suggests the stock is undervalued versus its expected growth.
The data clearly shows us that AstraZeneca is cheaper than its peers using the PEG valuation. And in this industry, it’s arguably the most important metric.
My take
Of course, investing in pharma and biotech is a risky business. These companies can spend billions on drug development for the product to never make it to market. Nonetheless, by investing in a behemoth like AstraZeneca, that risk is moderated by the size of its portfolio. I already hold AstraZeneca in my SIPP and I’m considering buying more. It may not scream ‘value’, but I really can’t ignore that attractive PEG number.


