BP (LSE:BP) shares dipped on Tuesday (31 October) after the company’s earnings came in lighter than expected. Consensus among analysts had been for $4.01bn (£3.3bn) in replacement cost profit. However, BP actually reported replacement cost profit of $3.3bn (£2.7bn).
As a side note, this shows just how difficult it can be for even the most experienced analysts to correctly forecast earnings, particularly BP. I recently produced a share tip for the energy giant, and I’m delighted to say I was under consensus. However, I didn’t see earnings being this low.
What the earnings say
Q3 won’t be remembered as one of BP’s strongest quarters, given the earnings miss and the earlier departure of CEO Bernard Looney.
The results showed improvement from the $2.6bn in the previous quarter, but fell significantly short of the $8.2bn achieved in Q3 of 2022.
Despite these challenges, the quarterly growth was driven by higher realised refining margins, reduced levels of refining maintenance, a robust performance in oil trading, and increased oil and gas production.
However, these positive factors were somewhat offset by weaker results in gas marketing and trading.
The company reported an increase in operating cash flow to $8.7bn from $6.3bn in the second quarter, and it reduced net debt to $22.3bn from $23.7bn over period.
10-year trend
So what if I’d invested in BP shares a decade ago? How well would my investment be doing today?
Well, the answer isn’t that good. The stock is up 4.5% over 10 years. That works out at less that 0.5% a year, plus dividends, which have been relatively strong.
Including dividends, my annualised total returns would be somewhere in the region of 4-5%. It’s not the worst, but it could be much better.
The next 10 years
Before I look at the macroeconomic forecasts, let’s take a closer look at BP versus the rest of the ‘Big Six’ vertically integrated oil companies.
Firstly, it’s worth noting that BP reportedly has a lower unit cost than its peers. Between 2010-2019, BP’s 10-year average upstream unit production cost ($9.46bn a barrel of oil equivalent) was roughly 18% less than that of Shell ($11.64).
When I worked in the industry and was writing my PhD, I was told that BP was always at the forefront of technology, in theory driving efficiencies. Perhaps as a result, BP’s return on total capital (TTM) is 16.7%, higher than all its peers.
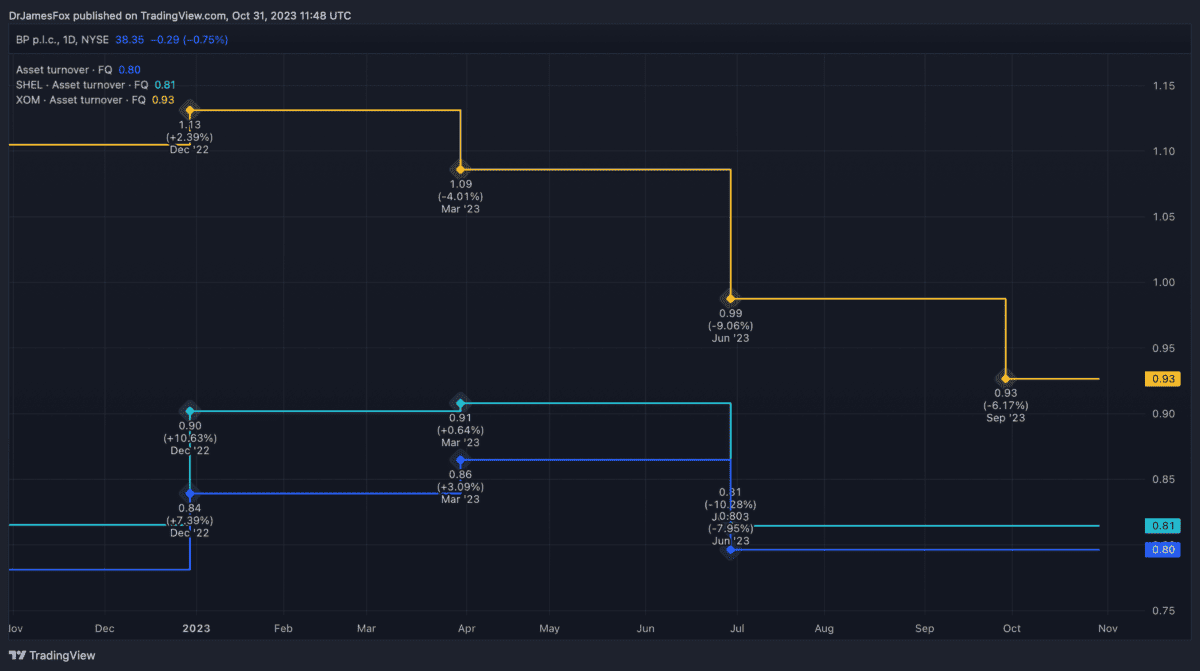
However, when we look at the asset turnover ratio and net income margin, we can see BP is less competitive. This probably reflect’s BP’s higher debt burden, which partially stems from the Deepwater Horizon disaster. This is highlighted below.

Looking at the macroeconomic picture, it’s hard to ignore the impact of growing populations, a growing middle class, and a dearth of untapped natural resources.
These factors all point to higher oil and gas prices over the next decade versus the previous decade. This is the consensus view, and should result in improved revenues over the next decade. In turn, this is also central to the investment hypothesis.
Given the geopolitical tensions and resultant energy volatility, I’m not buying BP now. However, I’m bullish on long-term prospects and will look for an improved entry points.


