The BT (LSE:BT.A) share price is languishing only a few pence away from its 52-week lows of 110p. Down 16% over the past year, I know I can’t be alone in mulling over whether this is an attractive value purchase right now. So I decided to dig deeper and look at some visual interpretations. Here’s what I found.
Getting a comparative feel
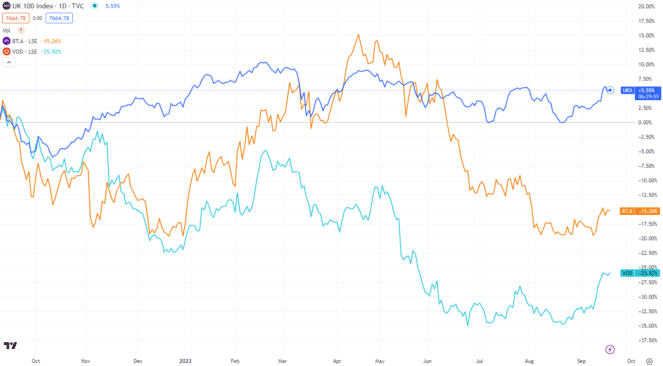
I think it’s important to not look at the BT share price movement in isolation. Rather, by comparing it to competitors and the broader market, I can get a better feel for potential value. To that end, the chart below shows the performance over the past year of the FTSE 100 (dark blue), BT Group (orange) and Vodafone (light blue).

Source: TradingView
Should you invest £1,000 in Iwg Plc right now?
When investing expert Mark Rogers has a stock tip, it can pay to listen. After all, the flagship Motley Fool Share Advisor newsletter he has run for nearly a decade has provided thousands of paying members with top stock recommendations from the UK and US markets. And right now, Mark thinks there are 6 standout stocks that investors should consider buying. Want to see if Iwg Plc made the list?
It’s clear that the business has underperformed the broader market quite considerably. Yet the loss isn’t as great as one of the main competitors, Vodafone. This tells me it could be the telecommunications sector as a whole that may be struggling relative to the rest of the market.
Getting the microscope out
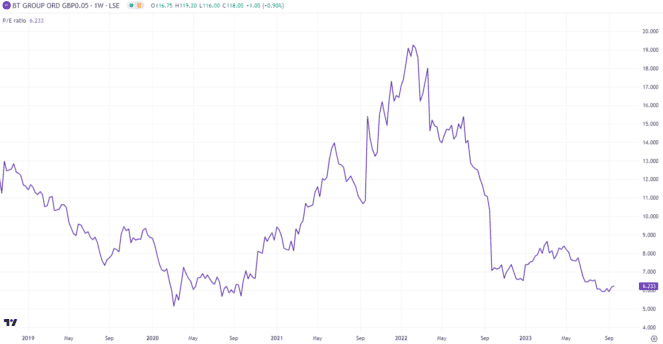
In the assessment that the sector could be undervalued, I now want to drill down to BT specifically. A good way of gauging value at a company level is looking at the price-to-earnings (P/E) ratio. A figure around 10 is what I use as a benchmark for fair value. The chart below shows the P/E ratio over the past couple of years.

Source: TradingView
This is a really telling chart. The stock hasn’t been trading this cheaply in almost two years. With a P/E ratio just above 6, I’d say this gives a strong indication the business is looking attractive.
Earnings are improving
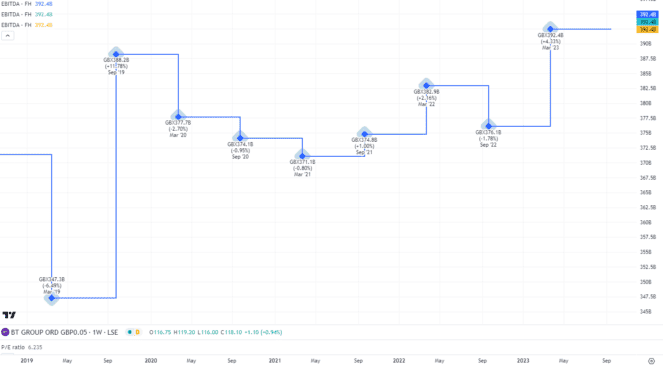
Some will argue that a low P/E ratio and a falling share price simply means people don’t think the firm is performing well. This is true in some cases, but not all. In fact, when I consider the earnings (EBITDA), I find quite the opposite.
The EBITDA for BT Group has been climbing over the past few years and is at the highest level since pre-Covid.

Source: TradingView
We have to wait until November to get the next set of results to see if this trend is continuing. But based on this, I don’t see a business that has material problems.
Not everything can be charted
Granted, the charts can’t tell me everything. For example, BT is set to take on a new CEO, Allison Kirkby, who’s set to join in January at the latest. A change at the top of the tree can be a worrying time for investors. They don’t know if a major strategy change could come, or if the new CEO will be able to handle the pressure. This isn’t something that can be quantified on a chart, but is a risk that needs to be appreciated.
On balance, I do feel that BT shares are good value at the moment and feel investors should consider adding the stock to their portfolio.


