Many financial commentators are talking about the current bull market being the longest in history as of today. By that, they are referring to the fact that the US market (the S&P 500 index) has now gone 3,453 calendar days without experiencing a 20% decline. Since the index’s bear market low of 676 points on 9 March 2009, it has risen over 320%. So what are the implications for UK investors? Should we be worried about a bear market?
US vs UK
You could argue that the FTSE 100 is perhaps less vulnerable to a bear market than the S&P 500. The FTSE 100 has a very different composition to the S&P 500 and this means that it performs differently to US stocks at times. Whereas the S&P 500 has gone 3,453 days without experiencing a bear market, the FTSE 100 actually entered bear market territory back in early 2016, after falling over 20% from its 2015 high.
As a result, with gas let out of the UK market in recent years, valuations here in the UK are definitely not as rich as they are across the Atlantic. For example, according to Stockopedia, the S&P 500 has a median trailing P/E ratio of 22.1 and a median trailing dividend yield of 1.9% while the FTSE 100 has a median trailing P/E of 16 and a median trailing yield of 3%. So on that basis, UK stocks don’t look as prone to a sizeable pull-back as US stocks do.
When the US sneezes…
Having said that, as the largest stock market in the world, the US has a large influence on how other international stock markets perform. If the S&P 500 should fall heavily, there’s a good chance that UK stocks would be hit hard too, unfortunately. Could we see the US market take a hit in the near term?
Risk factor
While economic data remains relatively healthy and sentiment towards stocks remains high, there are certainly some risks that are worth monitoring. One risk that has concerned me for a while now is the high valuations across the technology sector.
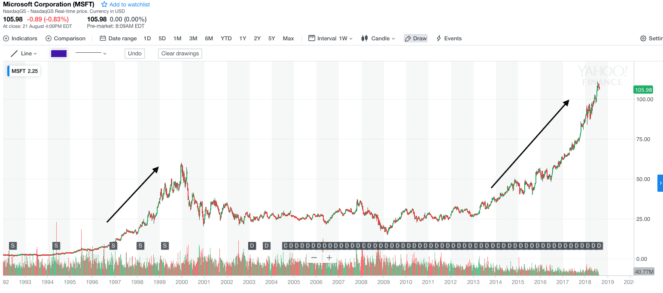
Technology stocks have a large weighting in the S&P 500, making up over 25% of the index at 31 July. But have investors got carried away with valuations in this sector? Currently, Amazon trades on a trailing 12-month P/E ratio of nearly 150. Similarly, Microsoft has a trailing 12-month P/E ratio of just under 50. Are these valuations sustainable? I’m not so sure. Microsoft’s long-term chart below looks a little concerning.

Veteran US market expert Jim Paulsen is worried that there is no more room left for valuations to grow, with stock valuations now among the top 82% in market history in the post-war period. In June, he estimated that there’s a 50/50 chance we could see a 15% market sell-off this year and urged investors who are overweight in large-cap technology stocks to take some profits off the table.
Check your portfolio
With that in mind, now might be a good time to check your portfolio to ensure that you’re comfortable with your current asset allocation and that your portfolio is still suited to your goals and requirements. Having a little bit of cash on the sidelines could also be a sensible idea, in my view, to ensure that you’re ready to capitalise if stocks do fall.


